
AppTerrain User Guide
Main dashboard window
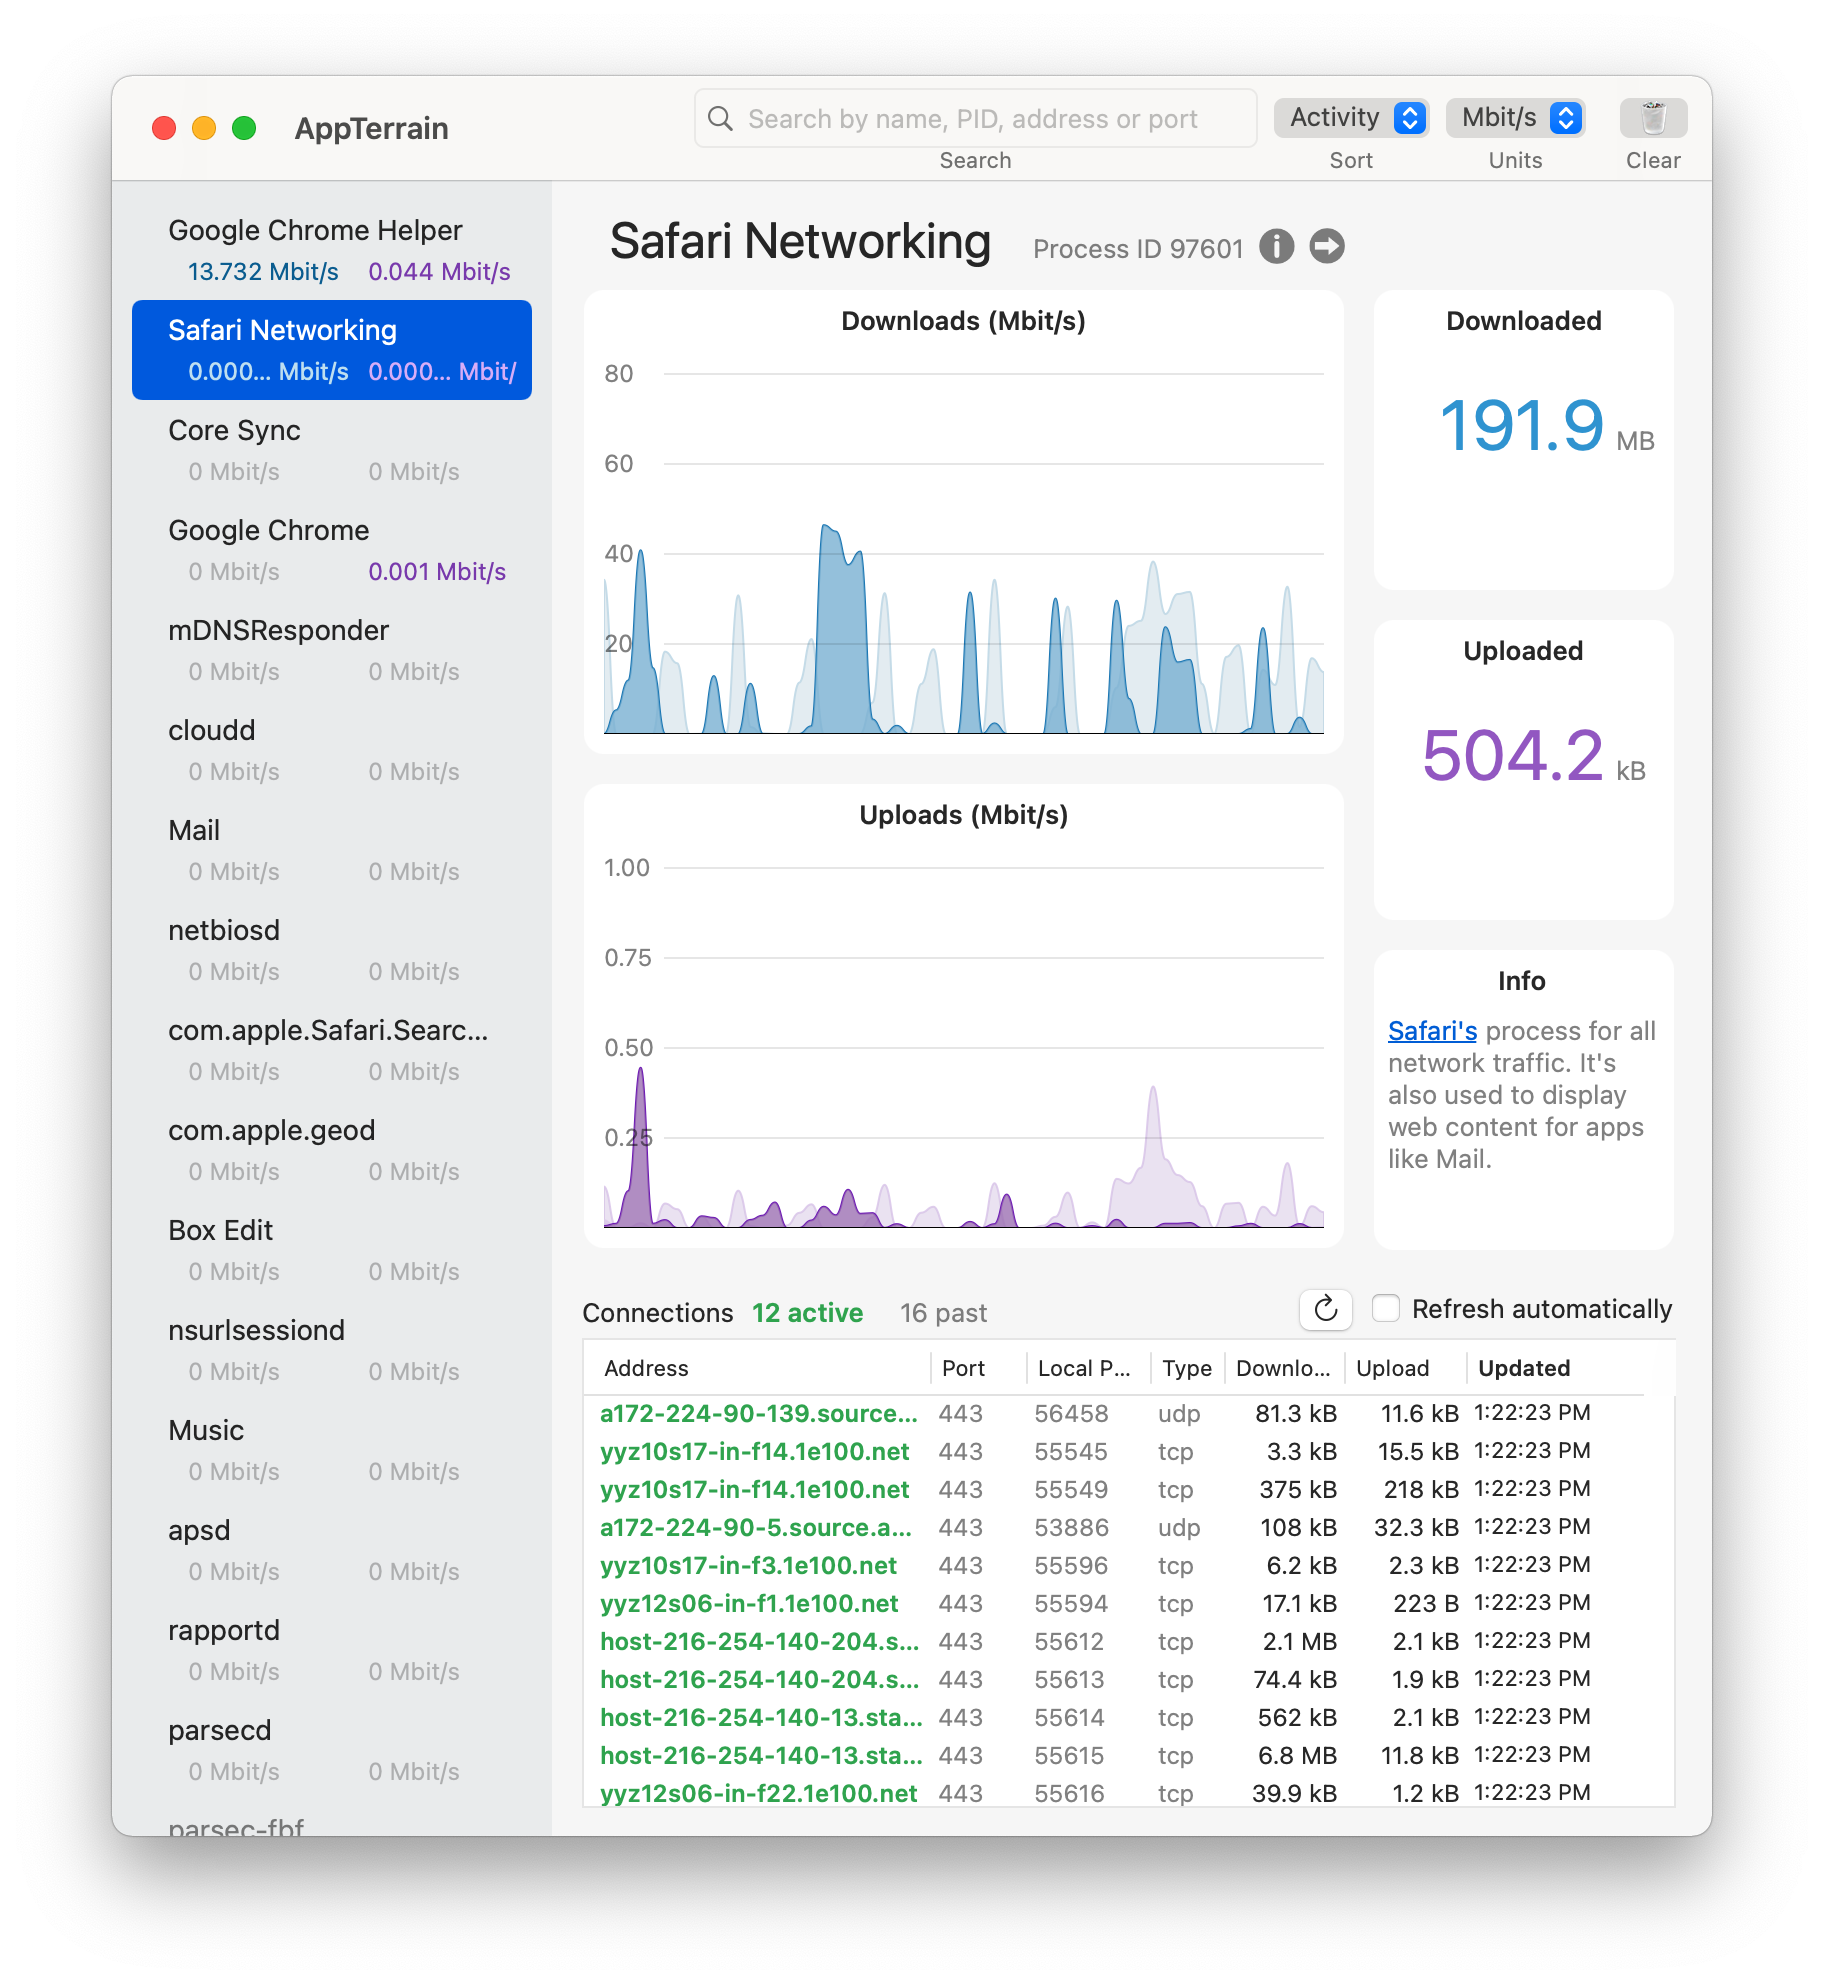
The main dashboard (Command+1) is the default window. On the left side is a list of processes with networking connections. The rest of the dashboard shows details for the selected process. As shown in the screenshot, the graphs include all of the individual processes. The selected process is shown in darker colors.
Process names are displayed in black text, and any current activity is shown below them in colored text: blue for downloads and purple for uploads. If the activity value is less than 0.001, it is displayed as "0.000…". If a process quits, the color of its name changes from black to gray.
If the process's executable command is available (mainly for apps you've launched) you can view it by clicking the info button next to the process ID at the top of the dashboard. You can then open the command's folder by clicking the arrow button. If the executable path is not available (and the process is still running) you can use the Terminal.app get the information using the command: ps -x -p PID (replace PID with the actual process ID).
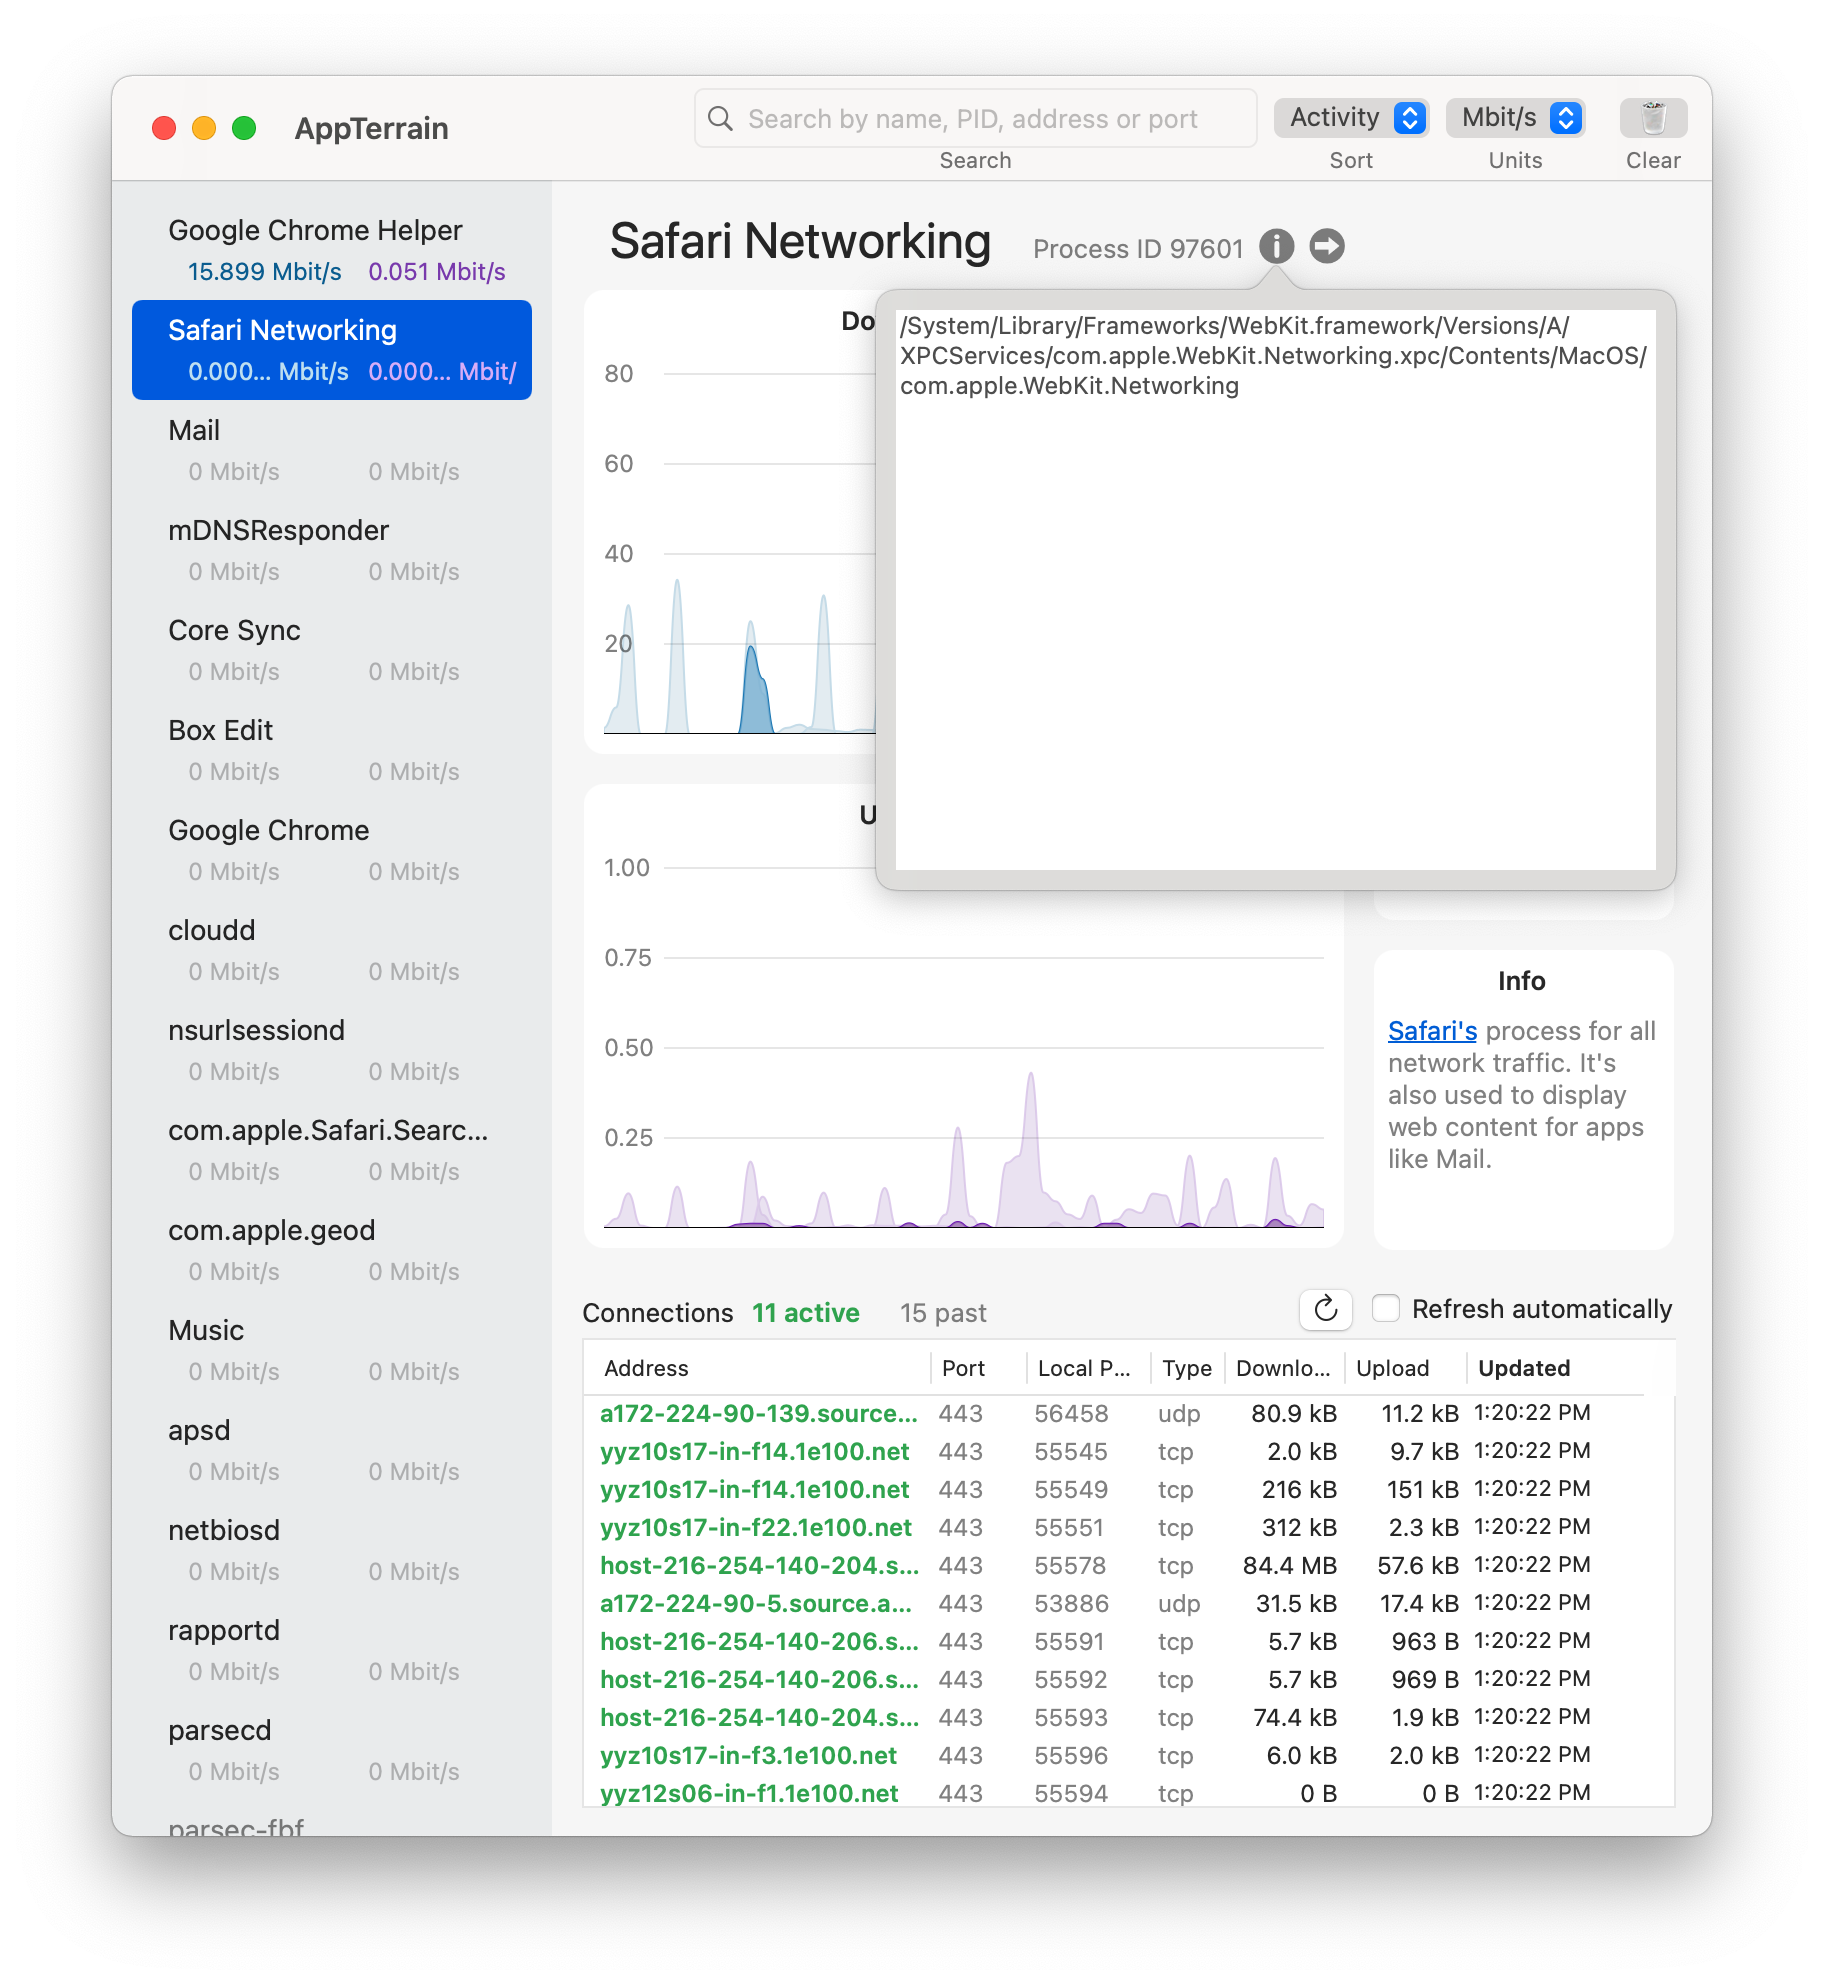
The Info box will show a short description for many common processes. We'll keep updating the library of descriptions!
Connections table
This is the table at the bottom of the dashboard. The Address column shows IP addresses and host names, with active connections in green and past connections in gray. By default, the connections are sorted by most recent activity, shown in the Updated column. For easier browsing and to use less CPU, the connections are not refreshed automatically. You can refresh them manually or enable automatic refresh (once per second) with these controls:

If you want to extract connection information, select the rows, and copy and paste them as comma-delimited text.
System usage mini-window
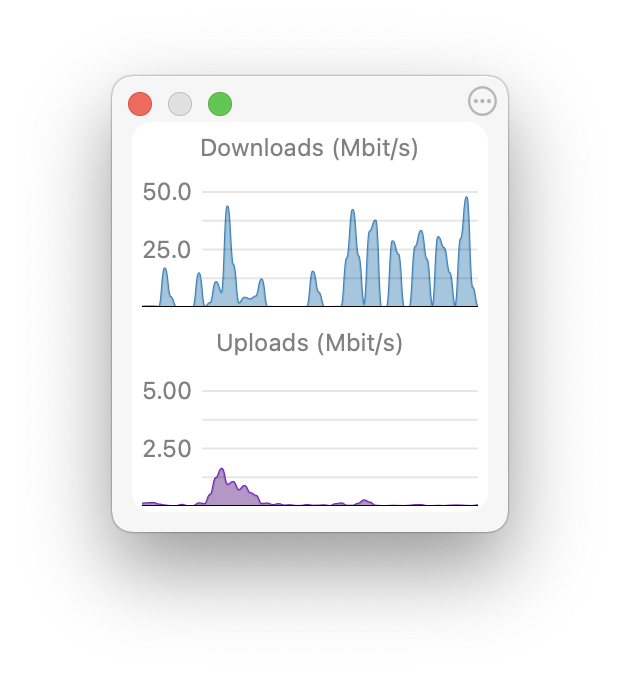
The system usage mini-window (Command+2) shows the total download and upload activity for the entire system in real time. To change the units and upper limits of the y-axis, click the settings button in the top right corner.
Logging
You can enable raw data logging from the main menu: Data > Log Raw Data. AppTerrain will ask you where to save the data, and macOS may prompt you to give the app permission to write to the location.
Performance and network monitoring
AppTerrain monitors network activity only when it is running. You can keep the app running indefinitely. To save CPU while it's running, you can hide the app (Command+h) or close (or minimize) its windows. The app will continue monitoring network activity and not update the user interface.